Gantt chart
Gantt chart is a type of bar chart used for schedules and dependencies. It came out in 1910.
- Came out
- 1910
All 2 facts, and where they come from
Facts
2 facts · 0 confirmed by two sources · 0 cited · 2 from one source
Where this comes from
Papalocal keeps its own record. It started from these sources; what each one said is kept here as it was copied, so a change on their side never changes this page by itself. Tap one to read its version.
What Wikidata says · copied November 17, 2026 · revision 2553004746
- Described as
- type of bar chart used for schedules and dependencies
- Other names
- Gantt charts, Gantt diagram, Gantt diagrams
- Came out
- 1910 · 1 reference
- Named after
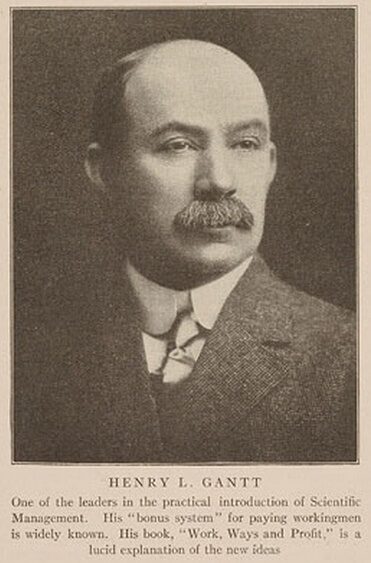
- Henry Gantt
- Wikipedias with a page
- 50
Wikidata item Q192847 (wikidata.org/wiki/Q192847), public domain (CC0). Copied 2026-11-17.
What Wikipedia says · copied November 17, 2026 · revision 1379039146
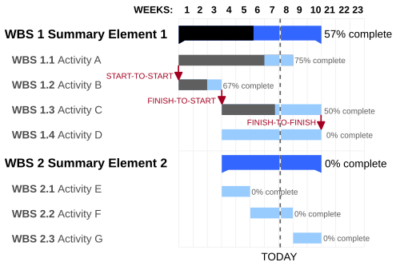
A Gantt chart is a bar chart that illustrates a project schedule used in project management. It was designed and popularized by Henry Gantt c. 1910–1915. Modern Gantt charts also show the dependency relationships between activities and the current schedule status.
From the Wikipedia article “Gantt chart” (en.wikipedia.org/wiki/Gantt_chart), by its contributors, under CC BY-SA 4.0 (creativecommons.org/licenses/by-sa/4.0/). Copied 2026-11-17; not changed.
Confirmed Two sources agree. Cited One source, and it names where it got it. One source One source, without a reference of its own. Sources disagree The sources disagree. We show the best-supported value and keep theirs below.
Picture: GanttChartAnatomy.png: Original uploader was Garrybooker at en.wikipedia Later versions were uploaded by Abdull at en.wikipedia. derivative work: Malyszkz (talk), via Wikimedia Commons · Public domain