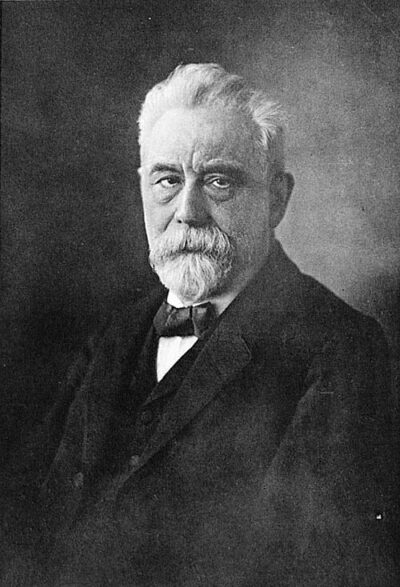
Lexis diagram
Lexis diagram is a diagram used in demographics.
All 2 facts, and where they come from
Facts
2 facts · 0 confirmed by two sources · 0 cited · 2 from one source
Where this comes from
Papalocal keeps its own record. It started from these sources; what each one said is kept here as it was copied, so a change on their side never changes this page by itself. Tap one to read its version.
What Wikidata says · copied November 19, 2026 · revision 2432102636
- Described as
- diagram used in demographics
- What it is
- mathematical concept
- Named after
- Wilhelm Lexis
- Wikipedias with a page
- 8
Wikidata item Q2247881 (wikidata.org/wiki/Q2247881), public domain (CC0). Copied 2026-11-19.
What Wikipedia says · copied November 19, 2026 · revision 1369995840
In demography, a Lexis diagram (named after economist and social scientist Wilhelm Lexis) is a two-dimensional diagram that represents events (such as births or deaths) that occur to individuals belonging to different cohorts. Calendar time is usually represented on the horizontal axis, while age is represented on the vertical axis. In some cases, the y-axis is plotted backwards, with age 0 at the top of the page and increasing downwards. Other arrangements of the axes are also seen, and some go back to Lexis himself. As an example the death of an individual in 2009 at age 80 is represented by the point (2009,80); the cohort of all persons born in 1929 is represented by a diagonal line starting at (1929,0) and continuing through (1930,1), (1931, 2), and so on.
From the Wikipedia article “Lexis diagram” (en.wikipedia.org/wiki/Lexis_diagram), by its contributors, under CC BY-SA 4.0 (creativecommons.org/licenses/by-sa/4.0/). Copied 2026-11-19; not changed.
Confirmed Two sources agree. Cited One source, and it names where it got it. One source One source, without a reference of its own. Sources disagree The sources disagree. We show the best-supported value and keep theirs below.